


UX research is the foundation of confident design. It's all about deeply understanding users—what they need, how they behave, and why they make decisions. When planning a study, knowing the right methodology is half the battle.
This glossary will help you decode essential terms, making it easier to plan, execute, and communicate your research effectively.
Quantitative & Observational Methods (The "What" and "How Much")
These methods focus on objective, measurable data:
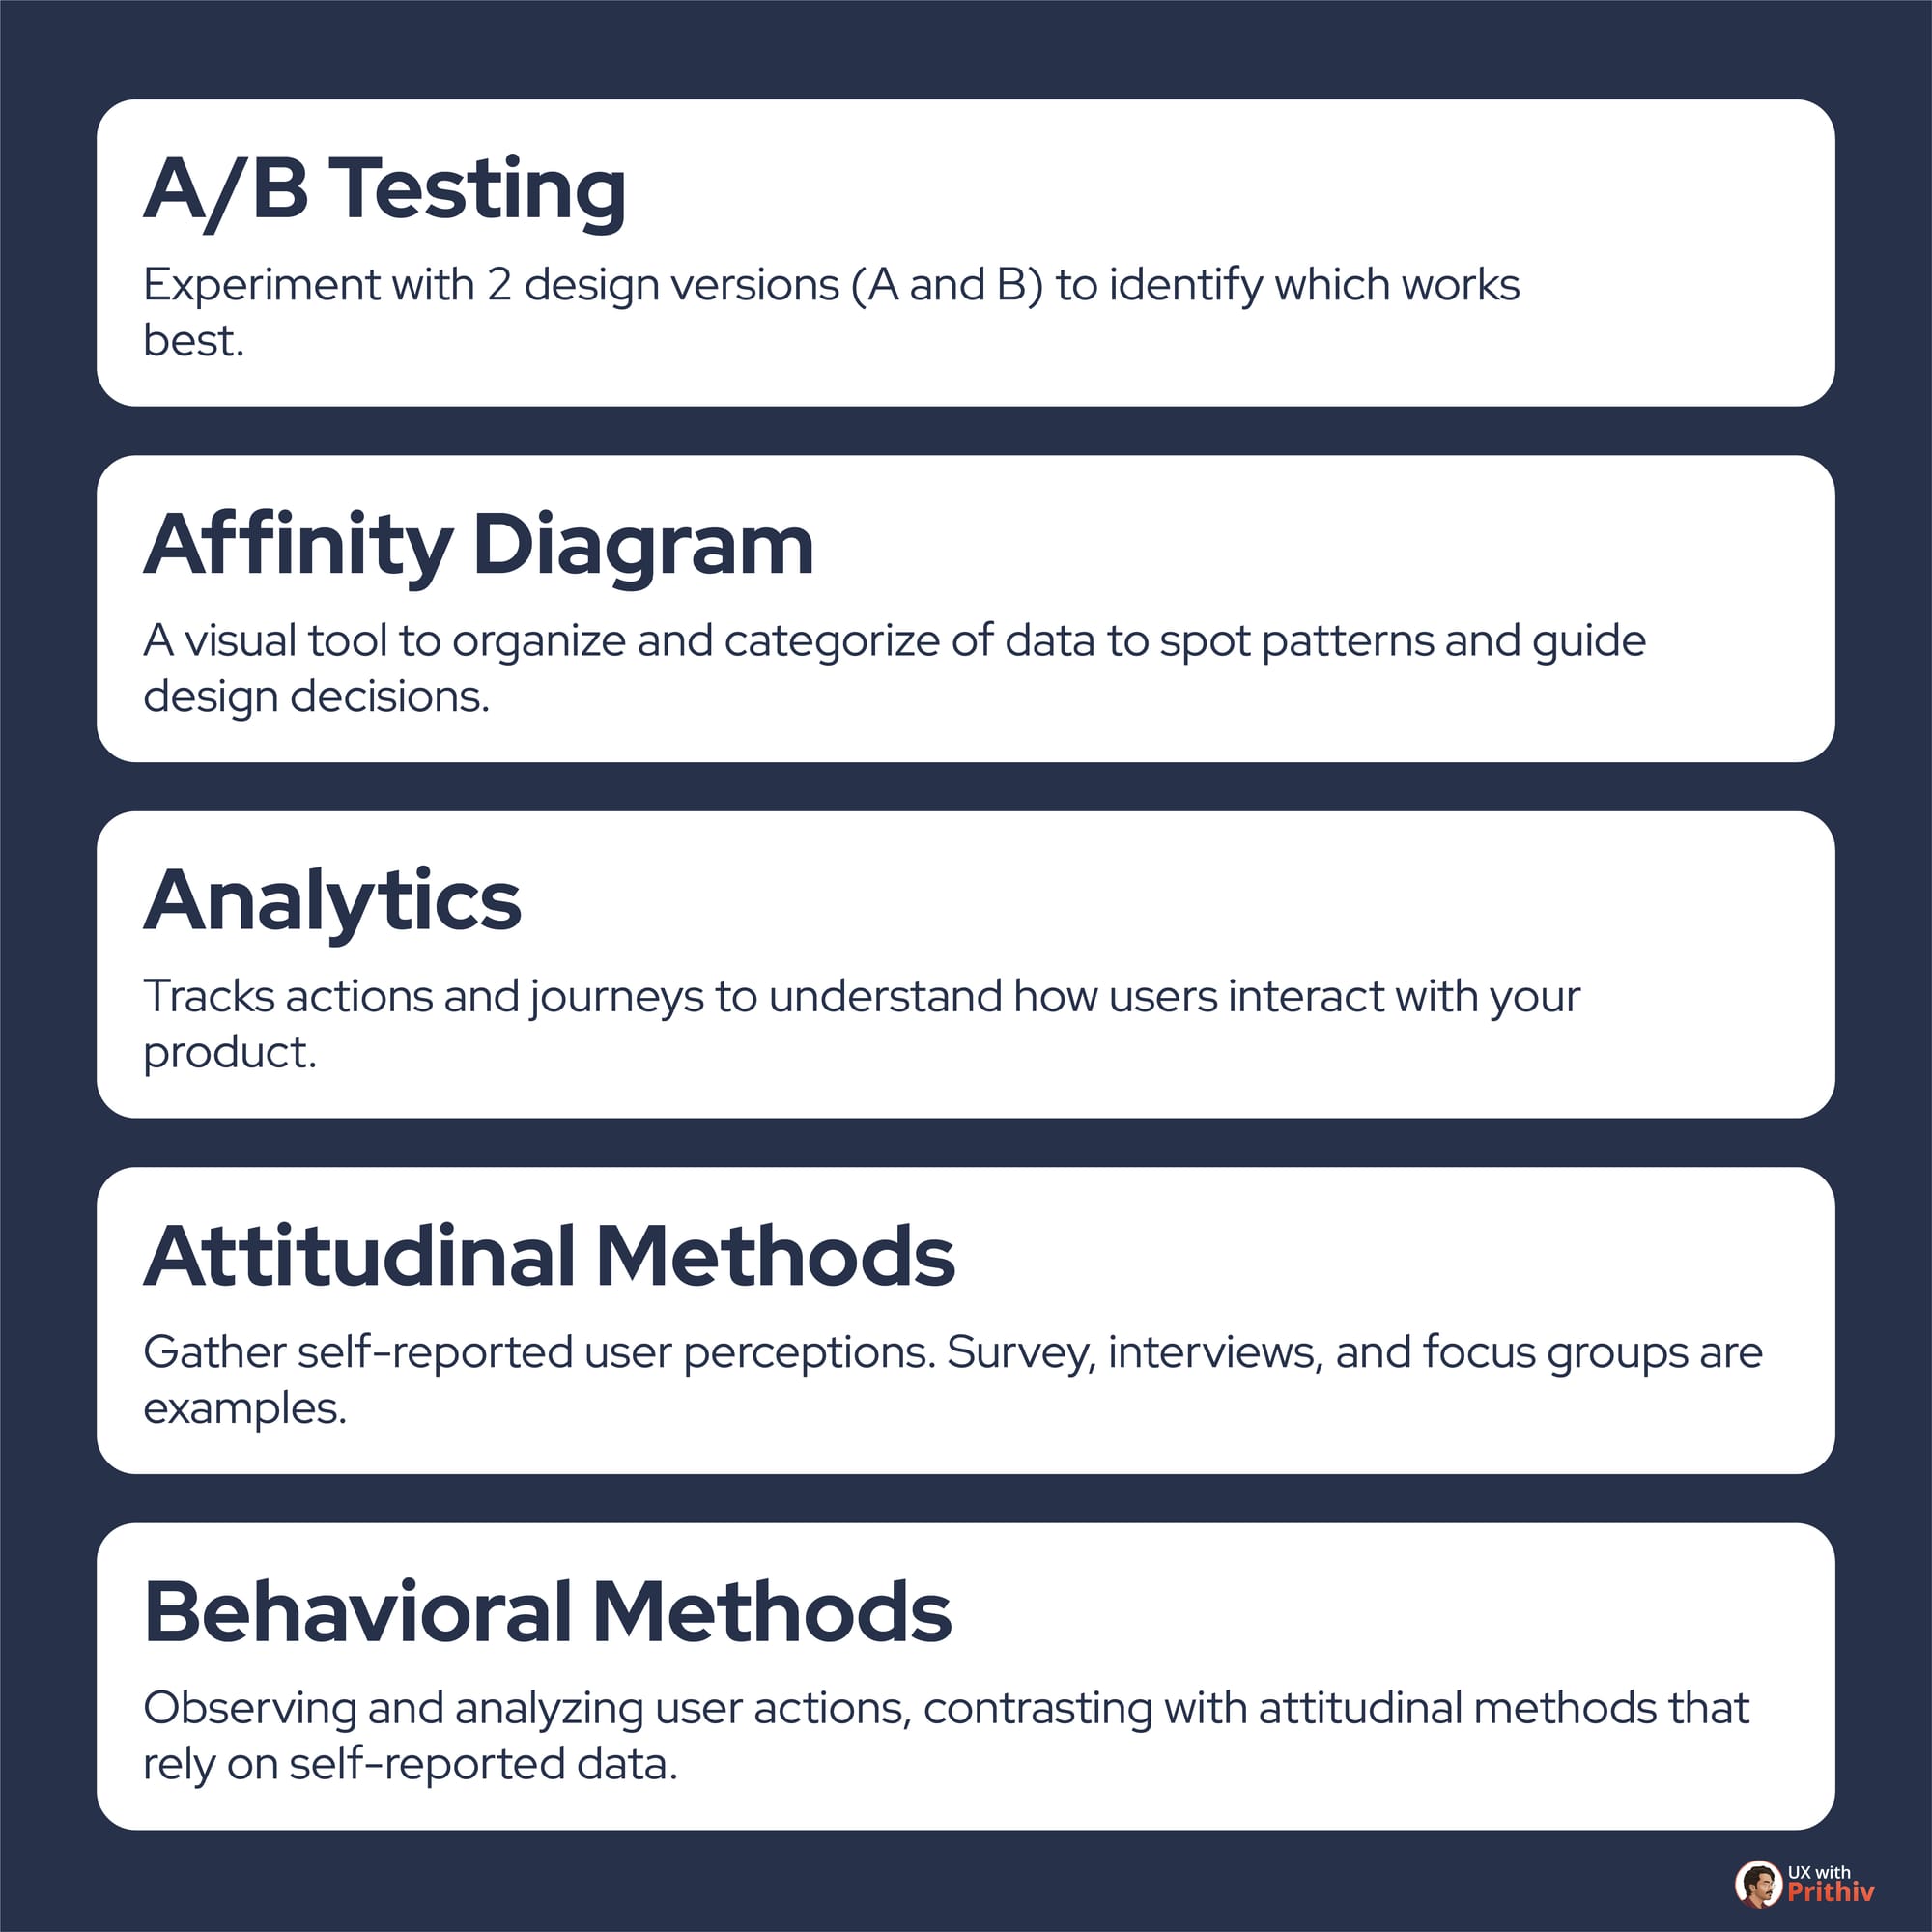
- A/B Testing: An experiment with two design versions (A and B) to identify which works best based on a defined metric.
- Analytics: A method for tracking actions and journeys to understand how users interact with your product.
- Benchmarking: The process of comparing a product or system to industry standards or competitors to evaluate its performance and identify areas for improvement.
- Behavioral Methods: Observing and analyzing user actions, which contrasts with attitudinal methods that rely on self-reported data.
- Clickstream Analytics: An analytics method that involves analyzing the sequence of pages that users visit as they use a site or application.
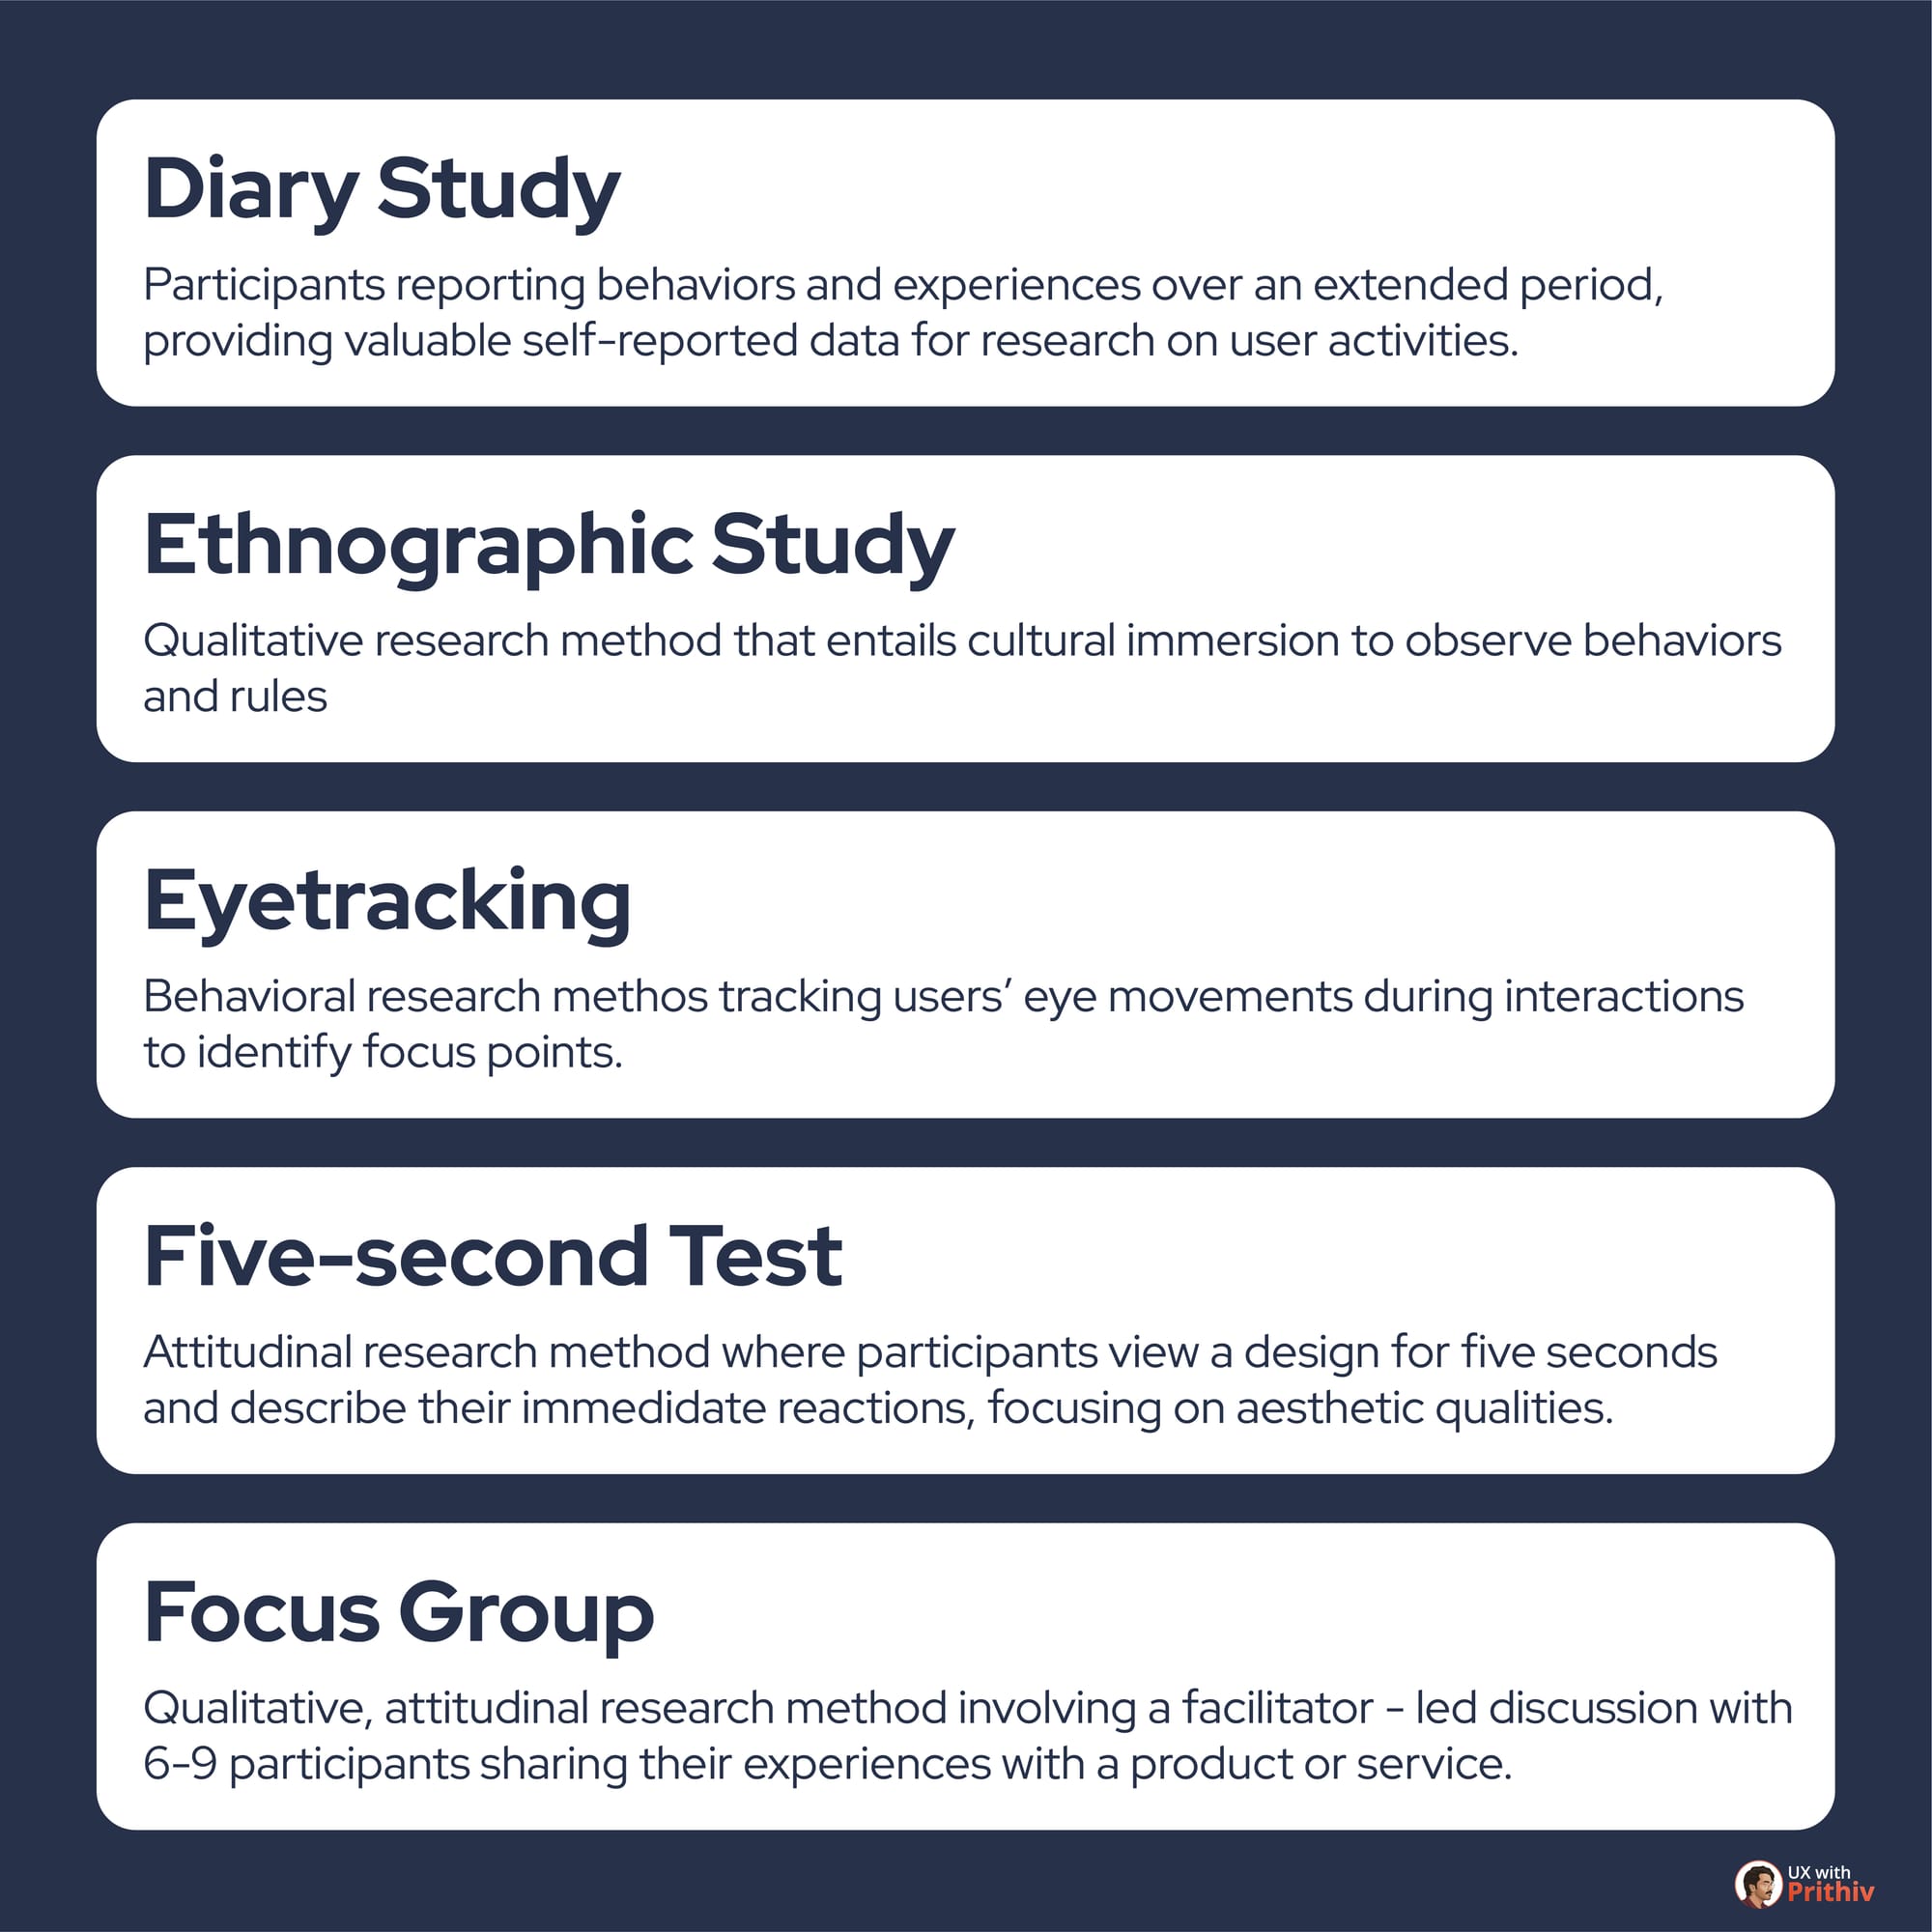
- Eyetracking: A behavioral research method that tracks users' eye movements during interactions to identify focus points and attention.
Qualitative & Attitudinal Methods (The "Why")
These methods focus on gathering perceptions, opinions, and deep insights into behavior:
- Attitudinal Methods: These methods gather self-reported user perceptions; examples include surveys, interviews, and focus groups.
- Contextual Inquiry: Observe and interview users in their natural environment to see how they interact with a product or service in real-life situations.
- Diary Study: Participants report behaviors and experiences over an extended period, providing valuable self-reported data for research on user activities.
- Ethnographic Study: A qualitative research method that entails cultural immersion to observe behaviors and rules.
- Focus Group: A qualitative, attitudinal research method involving a facilitator-led discussion with 6-9 participants sharing their experiences with a product or service.
Synthesis & Evaluation Methods
These tools help structure the data and validate design decisions:
- Affinity Diagram: A visual tool used to organize and categorize data to spot patterns and guide design decisions.
- Desirability Study: Participants express reactions to a product by choosing words from a list, which helps evaluate aesthetic properties for brand consistency.
- Five-second Test: An attitudinal research method where participants view a design for five seconds and describe their immediate reactions, focusing on aesthetic qualities.


Comments